|
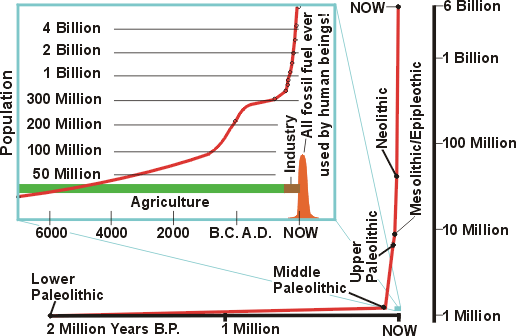
The graph shows the development of human numbers, resources and especially fossil fuels. Our modern life is primarily based on resources that were accumulated in the past and that are non-renewable. Under the present business as usual scenario it looks as if fossil resources will run out within a few generations. Then our "modernity" will belong to the past and we will be thrown back to living in line with what the sun and natural resourcres can provide on a day to day basis. |
|||
|
|
The graph is based on the resource scenario calculations by Meadows, Meadows and Randers (1992) and World Oil resources by Duncan and Younquist (1998). |
|||
ecoglobe
ecoglobe home | site index | sustainability | limits |--> Population graph | a chained globe
(zurück - retour - back) | 1999 ecology
discovery foundation new zealand (charitable trust) - 2005 - 5806